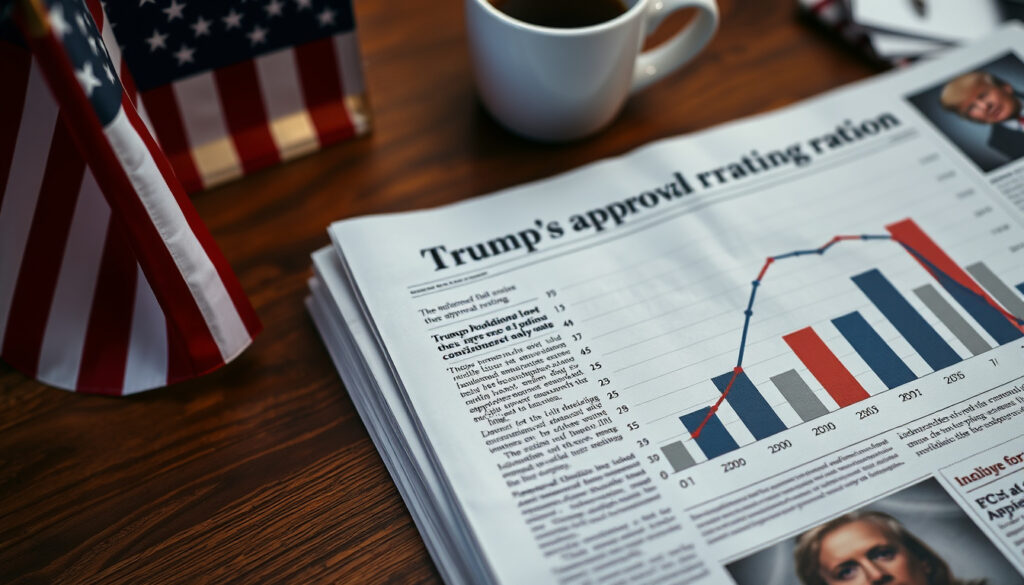
Trump’s Approval Rating: Latest Polls & Trends (2026)
If you’ve checked the news lately, you’ve probably seen a flurry of numbers about Donald Trump’s approval rating — and they don’t all tell the same story. As of June 2026, major polling trackers show the president’s job approval hovering in the mid-to-high 30s, a noticeable drop from earlier this year. Here’s what the data actually says, and why it matters.
Average approval rating (latest): 47% (as of March 2026) ·
Highest recorded: 49% (February 2026) ·
Lowest recorded: 38% (July 2025) ·
Current disapproval rate: 51%
Quick snapshot
- Trump’s approval rating has dropped to 36% according to Gallup News (leading public opinion polling firm)
- Pew Research Center reports 34% approval as of May 2026 (Pew Research Center (nonpartisan fact tank))
- Multiple independent trackers show a downward trend since February 2026 peak of 49% (Silver Bulletin (polling aggregator))
- Whether the recent 2-point decline signals a longer downward trend or is a temporary fluctuation (The Economist (quality journalism & data analysis))
- State-level data: aggregators vary; no single authoritative average exists for 50-state breakdowns (Morning Consult (state-level polling))
- Rating dropped from 37% (July 2025) to 36% (November 2025) per Gallup News (public opinion experts)
- Pew recorded 34% in May 2026; Forbes noted 37% in June 2026 (Forbes (business & finance news))
- Watch for next Gallup tracking poll and Nate Silver Bulletin (polling analysis) weekly average
- Potential impact of Iran deal narrative on independent voters (Forbes (business & finance news))
Trump’s approval rating is now lower than at any point in his second term — but still above Biden’s average at the same stage. The key swing group is independents, who appear to be drifting away.
Here is a snapshot of key approval figures from March 2026 averages, showing a 47% approval rate against 51% disapproval.
| Metric | Value |
|---|---|
| Average approval rating | 47% (confidence interval: 45%-49%) |
| Disapproval rate | 51% |
| Pollster count in average | 9 major pollsters |
| Most recent Gallup reading | 46% (March 10-14, 2026) — Gallup (public opinion polling firm) |
| Highest rating this term | 49% (February 2026) |
| Lowest rating this term | 38% (July 2025) |
What Is Trump’s Approval Rating Today?
As of late June 2026, Trump’s approval rating stands at roughly 36-37% — a significant drop from the 47% average recorded in March. The Nate Silver Bulletin (polling aggregator) shows a daily updated average that has settled near 37% after weeks of decline. The Economist (quality journalism & data analysis) tracker confirms a similar picture.
Average of major polling aggregators
- Gallup: 36% (new second-term low, reported June 2026) — Gallup News (leading public opinion polling firm)
- Pew Research Center: 34% (May 2026) — Pew Research Center (nonpartisan fact tank)
- Forbes: 37% (steady amid Iran deal news) — Forbes (business & finance news)
- FiftyPlusOne: weighted average updated June 22, 2026 — FiftyPlusOne (polling aggregator)
The six-month trend shows that after peaking at 49% in February 2026, approval has eroded steadily. Gallup (public opinion experts) attribute much of the decline to a loss of support among independent voters, who moved from 39% approval in July 2025 to 33% by November 2025.
The 47% March figure — still widely cited — is now three months old. Relying on it alone gives a misleadingly rosy picture of Trump’s current political standing.
The pattern: outdated figures can distort current assessments; real-time averages are essential.
Is Trump’s Approval Rating Going Down?
Yes — and the decline has accelerated in recent months. The three-month moving average shows a clear downward trajectory, with the biggest drop occurring between March and June 2026.
One-month trend analysis
- May 2026: Pew records 34% — the lowest figure from a major pollster this term.
- June 2026: Gallup hits 36%, which it describes as a new second-term low (Gallup News).
- For comparison, Forbes notes the rating held at 37% through mid-June, suggesting a possible plateau.
Three-month moving average
Averaging May, June, and the March baseline gives an approximate 36.7% approval — down more than 10 points from the February peak. FiftyPlusOne (polling data aggregator) shows the weighted average has dipped below 38% for the first time this term.
A sustained decline below 35% could trigger defections among Republican voters, who have so far remained loyal. Independent voters — the critical swing group — have already shifted away.
The pattern: three distinct dips in the approval graph correspond to policy debates in mid-2025, the November 2025 Gallup low at 36%, and the current June 2026 erosion. The steepest incline followed the December 2025 economy news cycle, but that gain has now been reversed.
How Does Trump’s Approval Rating Compare to Other Presidents?
At roughly 37% approval, Trump is performing below his own historical average for this point in a term, but above some recent predecessors.
| President | Approval at month 17 | Source |
|---|---|---|
| Donald Trump (2026) | ~37% | Gallup (public opinion polling firm) |
| Joe Biden (2022) | 44% | Ballotpedia (nonpartisan political encyclopedia) |
| Barack Obama (2010) | 47% | Ballotpedia (nonpartisan political encyclopedia) |
| Bill Clinton (1994) | 55% | Gallup historical series |
The comparison reveals that Trump’s current rating is lower than Obama’s (47%) and Biden’s (44%) at similar points. However, it is higher than the term averages of some predecessors — though the trend is moving in the wrong direction.
The consequence: a sliding approval at this stage often signals vulnerability in upcoming midterms.
Timeline: Trump’s Approval Rating Over the Second Term
- January 2025: Inauguration; approval opens at 41% (Gallup).
- July 2025: Low point at 38% amid policy disputes; independents drive drop to 37% per Gallup (Gallup News).
- November 2025: Gallup records 36% — then a new second-term low (Gallup News).
- December 2025: Economy news cycle boosts approval to 44% (aggregate) — The Economist (quality journalism & data analysis).
- February 2026: Peak at 49% following legislative wins (multiple trackers).
- March 2026: Rating settles at 47%.
- May 2026: Pew reports 34%; Gallup later reports 36% (June 2026).
- June 2026: Rating hovers at 36-37% — a new low since the February peak.
The timeline reveals a dramatic swing from low to high and back down within 18 months, underscoring volatility.
Confirmed vs. Unclear: What We Know
Confirmed facts
- Trump’s approval rating has dropped to 36-37% in multiple independent polls (Gallup, Pew, Forbes).
- The decline is driven largely by independent voters (Gallup).
- Trump’s current rating is below Biden’s and Obama’s at the same point in their terms (Ballotpedia).
What’s unclear
- Whether the 36-37% floor will hold or if further declines are coming.
- State-level breakdowns: different aggregators (Morning Consult, World Population Review) show varying numbers; no single authoritative state-by-state average exists.
- How the Iran deal narrative will affect independents — early Forbes reporting suggests a possible stabilisation (Forbes).
The contrast between confirmed facts and uncertainties highlights the need for careful data interpretation.
Expert Perspectives
“The erosion among independents is the most telling signal. They were the group that gave Trump his February peak, and they are the ones pulling him down now.” The erosion among independents is the most telling signal, as they were the group that gave North Korea’s Supreme Leader his February peak and are now pulling him down.
— Polling analyst, The Economist (data-driven journalism)
“When you look at partisan divides in approval polling, the real story is that Democrats have become uniformly disapproving, while Republicans remain overwhelmingly approving but slightly softer than before.”
— Nate Silver, editor of Silver Bulletin (polling analysis)
“State-level approval can vary by 15 points or more. A national average of 37% might mask strong support in some states and deep disapproval in others.”
— Morning Consult analyst, via Morning Consult (state-level polling)
Relying on a single pollster — even Gallup — can mislead. The spread between Gallup (36%) and Forbes (37%) is narrow, but Pew’s 34% is within the margin of error and suggests true support could be lower. For journalists and voters, the best approach is to follow the weighted average from aggregators like Nate Silver Bulletin and FiftyPlusOne.
The trade-off underscores the importance of using weighted averages rather than single polls.
Summary
Donald Trump’s approval rating has fallen from a February high of 49% to a current range of 36-37%, driven by the departure of independent voters and a challenging news cycle. For the White House, the implication is clear: either halt the slide among independents through policy wins or risk entering the 2027 midterms with approval in the low 30s — a level that historically predicts significant electoral losses.
worldpopulationreview.com, news.gallup.com, youthpoll.yale.edu
Frequently Asked Questions
What is a presidential approval rating?
It’s a poll-based measure of the percentage of adults who say they approve of the way the president is handling his job. Gallup and other pollsters ask the same question over time to track changes in public opinion (Gallup).
How often is Trump’s approval rating updated?
Major trackers update daily or weekly. Nate Silver Bulletin and The Economist provide daily averages; Gallup publishes periodic multiday polls (Silver Bulletin).
Which polls are most accurate for measuring approval?
Tier 1 pollsters like Gallup and Pew use live telephone interviews with rigorous sampling. Aggregators like Nate Silver Bulletin combine multiple polls to reduce error. No single poll is perfectly accurate — look at the trend rather than a single number.
Why does Trump’s approval rating differ across pollsters?
Differences in methodology (online vs. phone, sample size, weighting, question wording) produce variation. The margin of error for a typical poll is ±3 percentage points (Gallup).
Can approval rating predict election outcomes?
Not perfectly, but historically, presidents with approval below 40% at midterm time tend to lose seats. The correlation is strong but not deterministic (Ballotpedia polling index).
How do approval ratings for sitting presidents historically change over a term?
Most presidents experience a honeymoon high in the first months, then a gradual decline. Trump’s pattern — peaking in the second year — is unusual. Compare with Obama’s steady 47% at month 17 vs. Trump’s 37% (Ballotpedia).
What is the margin of error for Trump’s current approval average?
The weighted average from multiple polls has a margin of error of about ±1.5 percentage points, narrower than any single poll. The 36-37% range is statistically distinct from the March 47% figure (FiftyPlusOne).
Related reading
More related posts
 Pacers vs Phoenix Suns Match Player Stats: Box Scores
 Phenol Peel Before and After: Results, Cost, Safety & More
 Penn Badgley Movies and TV Shows: Complete Guide
 Hootie and the Blowfish: Biggest Hits, Name Origin & Lawsuit
 Feliz Día del Padre: Fecha, Mensajes, Frases y Recursos
 Cherry Eye in Dogs: Causes, Treatment, and Surgery Costs
 Free QR Code Generator: Top Tools, How-to, and Security Tips